Distribution Display
This screen shows the distribution data from the selected query.
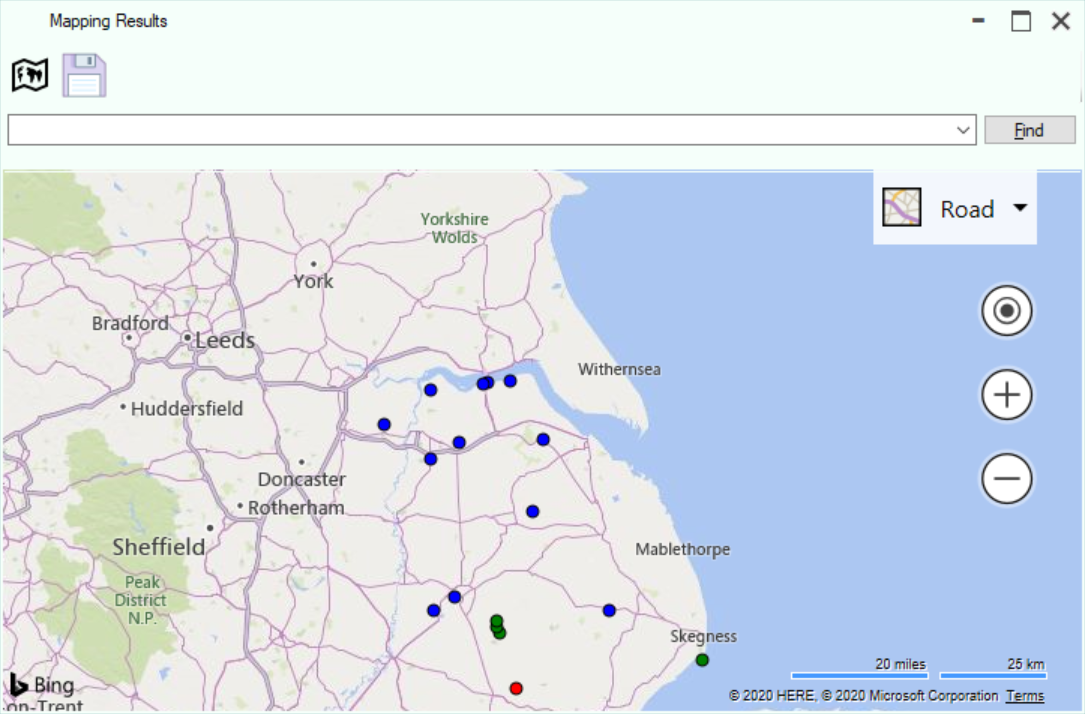
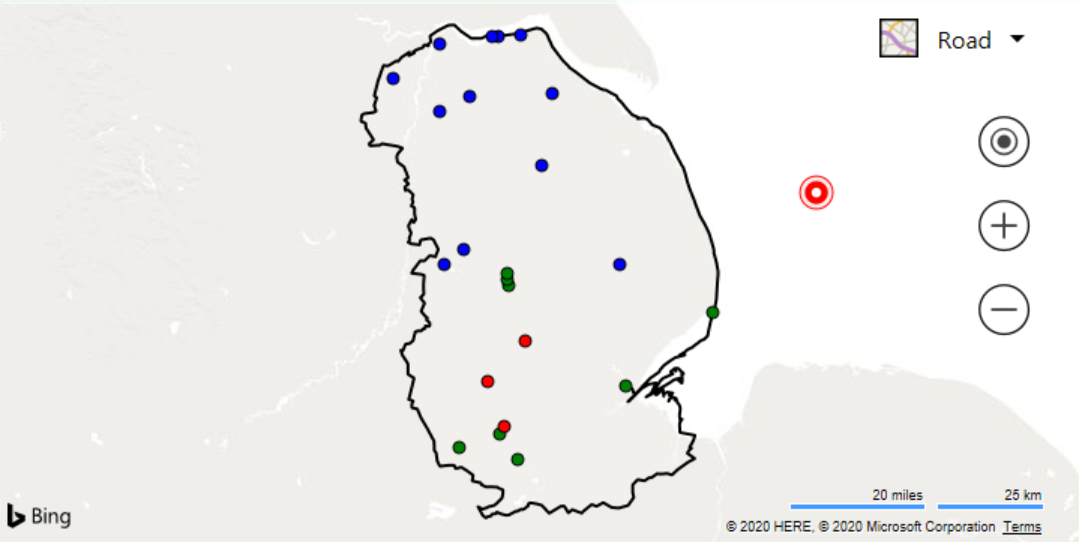
Different species are plotted in different colours. Where a location has more than one species it is shown as a red dot.
Hovering the mouse pointer over a point will show an information window.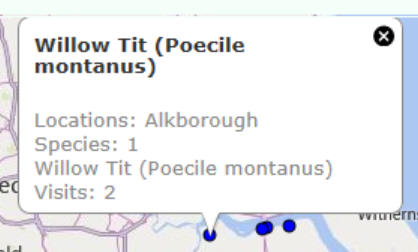
The amount of detail shown on the map can be reduced by clicking the detail button.
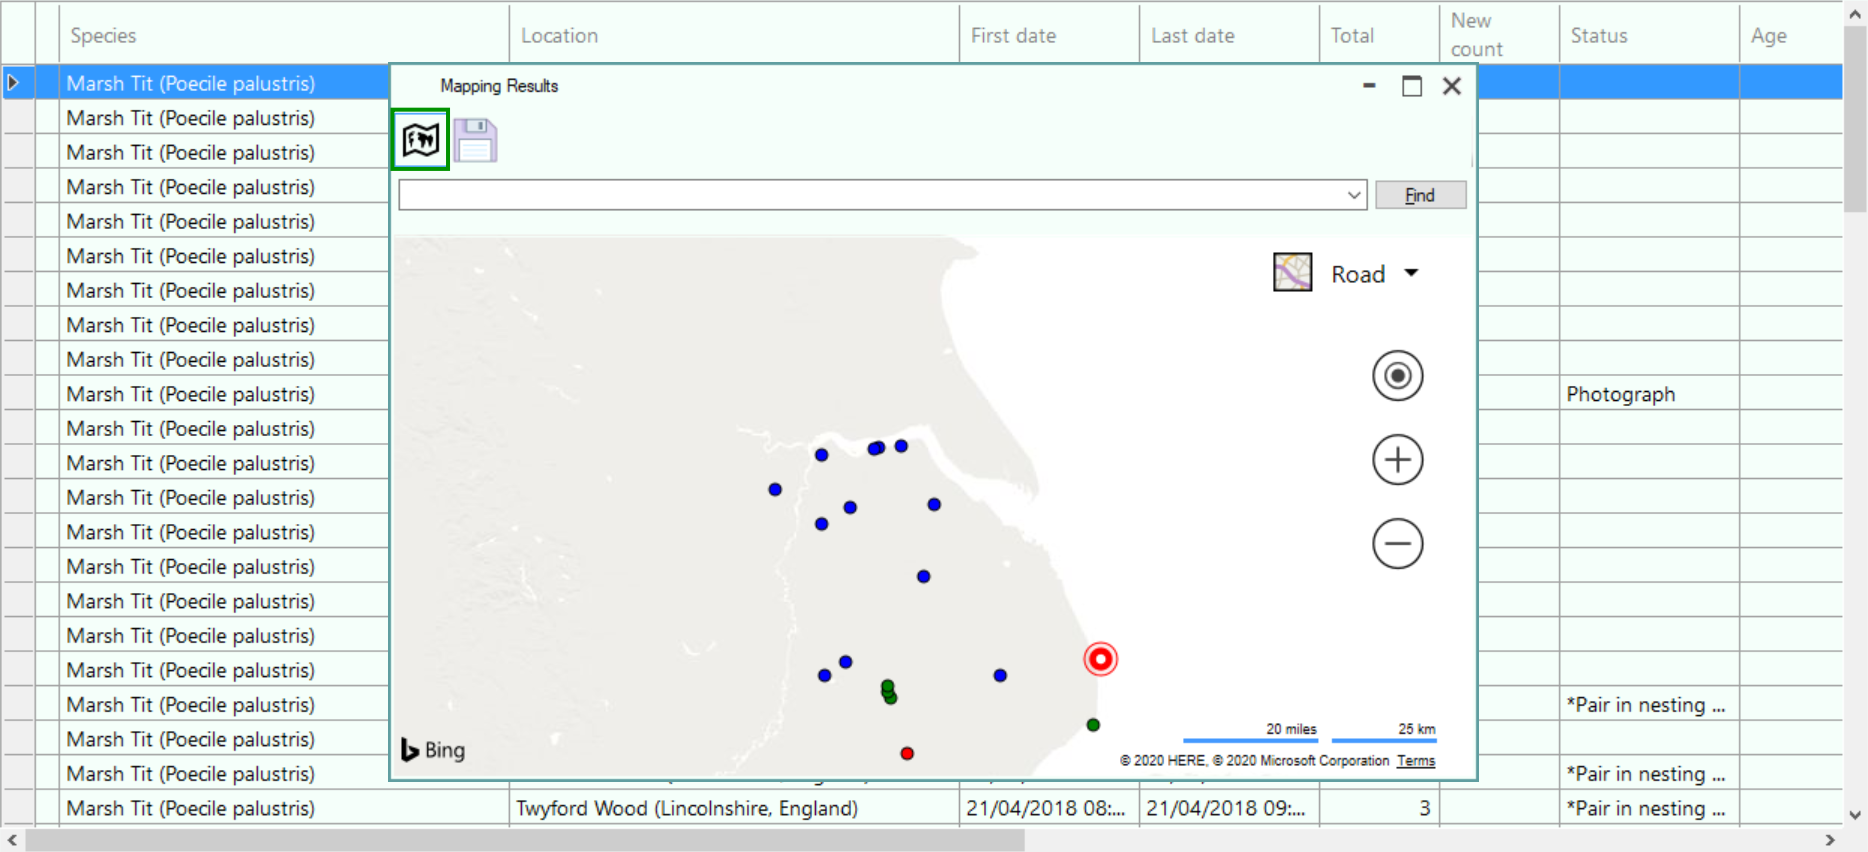
The underlying plotting data can be exported as a csv file by clicking the Export button. The data can then be used in any other GIS package such as QGIS.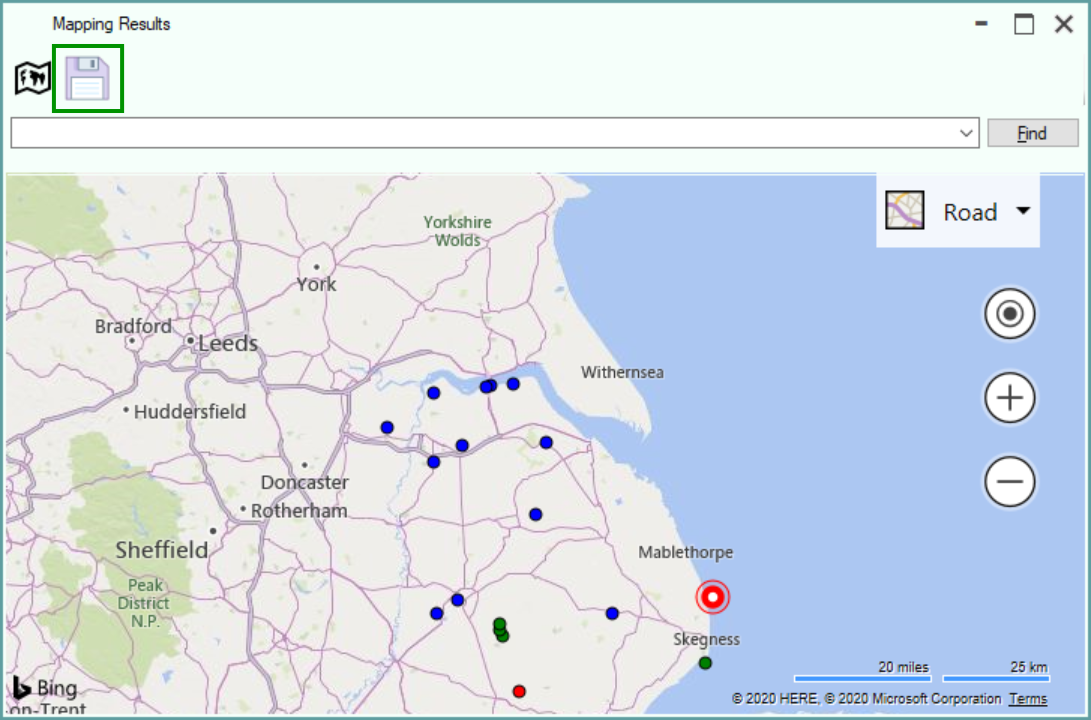
If you have a Geo JSON file, for example a county outline, you can display it by dragging the GeoJon file from a File Explorer window and dropping it onto the map.