Mapping Projects
Two type of projects can be created:
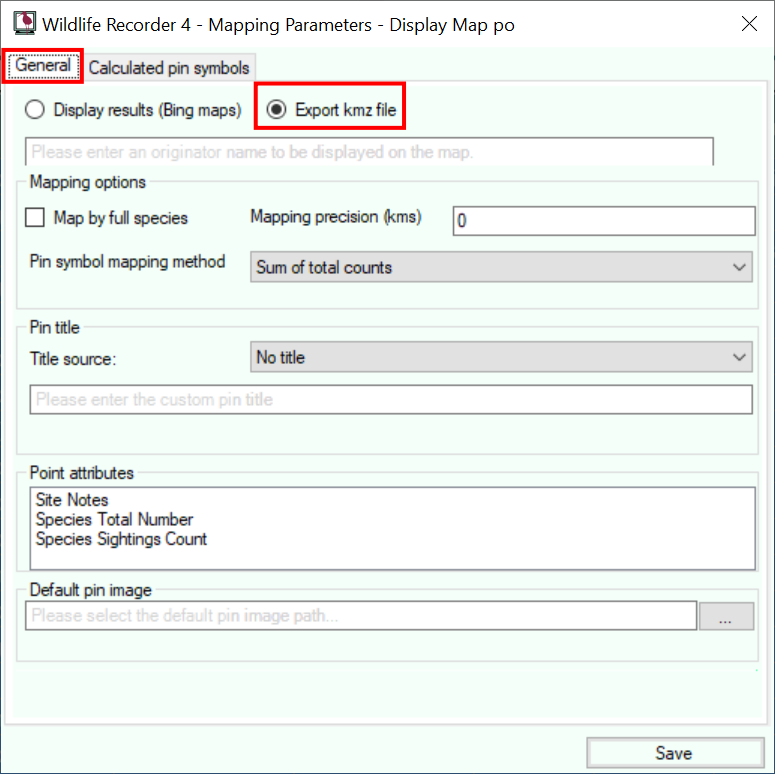
- A project for a map to be displayed within WR4. select option Display Results.
- A project to create a KMZ file for use with Google Earth or Google Maps, select option Export kmz file.
Originator Name
Enter the name of the person or society you want displayed as the data originator when using Google Earth or Maps.
Options
These options define how the sightings point pins or point size will be calculated. The following options can be defined:
Map Full Species: Select this option if you wish to combine all the subspecies for a species.
Mapping Precision in Km: Enter the required mapping precision for example enter 2.5 will cause all sightings within a 2.5 km radius into a single mapped plot. It is recommended that you do not enter 0 in this field.
Pin Symbol Mapping Method: Select one of the following options:
Maximum total count - If this option is selected the Max count of individuals in all sightings for a species will be used to determine which mapping symbol will be used.
Sum of total count - If this option is selected the total count of individuals in all sightings for a species will be used to determine which mapping symbol will be used.
Record Count - If this option is selected the total number of sightings of a species in a particular plot will be used to determine which mapping symbol will be used.
GeoJson Overlay
If you are creating Display Results project which will display in Bing maps then it is possible to drag an overlay in a GeoJson file onto the map. The following parameters allow you to define the colour and width of the overlay lines which will be displayed. Select the desired colour from the colour drop-down and enter the required line width
Pin Title
A title will be assigned to each point on the map, the value to be shown can be set as follows:
No title - Select this option if you do not wish to display a title for each plotted point.
Custom Title - Select this option to use the text entered in the Custom pin title field as the title for every plotted point.
Species Name - Select this option to display the species name as the title N.B. This option is only useful for sightings selections containing records for a single species.
Location Name - Select this option to display the location name of the sighting as the title. N.B. If you specify a large mapping precision the location name may contain the names of more than one site.
Placeholder Data
This section allows you to specify what data should be displayed as the text associated with the plotted point. Species Name and Site name are always included and you can also add any of the following data:
Site Notes - Select this option if you wish to display the notes associated with a site. N.B. If the mapping precision is large and causes multiple sites to be plotted as a single place holder then the notes will not be displayed.
Species Total Number - Select this option to display the total number of individuals seen for each species.
Species Sightings Count - Select this option to display the number of sightings records summarised into this place holder.
Default Point marker
This defines name of the image which will be displayed or sightings which do not have a status or count field which matches a specifically defined symbol in the Calculated Point Markers section.
This defines the marker that will be used on the map when no specific calculated marker is relevant (see below for calculated markers).
For Display Projects the marker is a round circle defined by using the following parameters:
Fill colour - Set the colour the point is to be filled with from the droop-down. If you select "Auto Species" a different colour will be automatically assigned for each of up to 10 different species. If more than 1 species is present at the plotted point the fill will be red.
Point size - Enter the size in pixel for the point.
Outline colour - Select the outline colour for the point (This can be the same as the fill colour if preferred).
Width - Enter the width in pixels for the outline.
For Google Earth and Google Maps the marker is a bitmap or png file of your choosing.
Click the ... button to display the list of provided bitmaps. Google Earth placeholders icons are small images in the .png format. Several icon images are provided with the system and can be found in the GE Icon folder under the Wildlife Recorder install folder. If you have a custom icon which you wish to use you can navigate to their location. Double-click on the desired image name.
Calculated Point Markers
It is possible to define different mapping symbols to be used when plotting sightings containing particular status codes or having particular counts. This facility is optional, if you do not define any symbols the default point marker will be used. Click on the Calculated Pin Symbols tab to define your requirements.
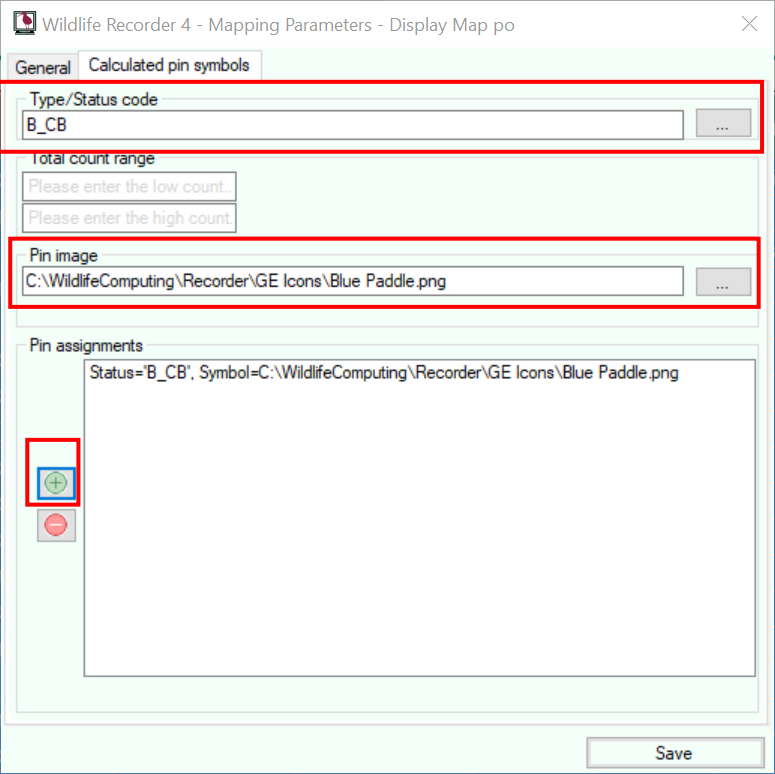
To associate a symbol with a status code; select the Status code from the Status Code drop-down then select the point image or set the point size (see above). Click the + button to add the entry to the list. N.B. If the sightings selection to be mapped contains more than 1 species this setting will be ignored.
To associate a symbol with sightings individual counts; enter the low and high values for the count, hen select the point image or set the point size (see above). Click the + button to add the entry to the list. N.B. If the sightings selection to be mapped contains more than 1 species then the number of species seen at the location of the point will be used to determine which point marker will be displayed.
To remove a symbol from the list, select the entry in the symbol list then click the - button.
Click the Save button to save the mapping project parameters.
 Two type of projects can be created:
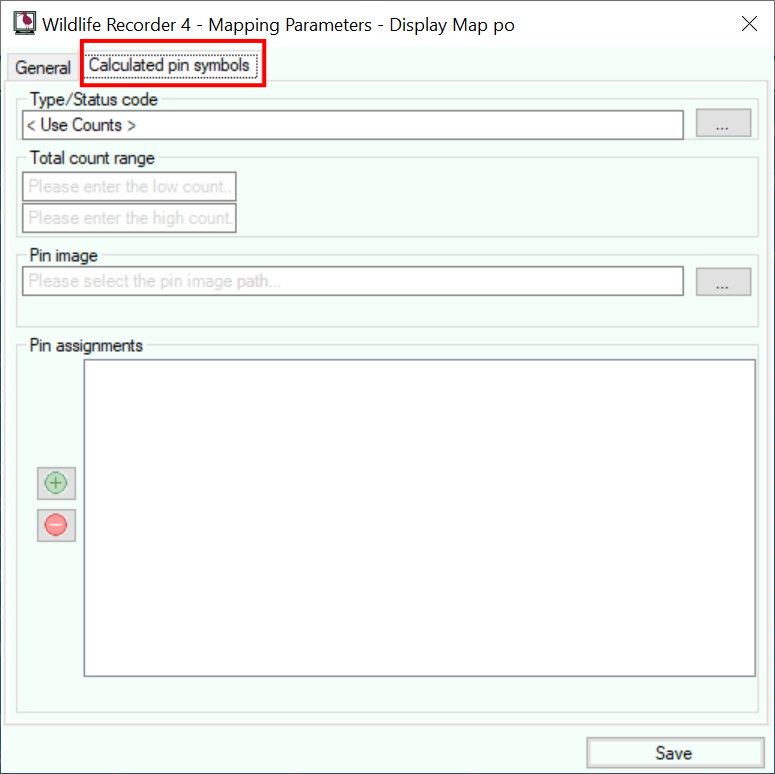
 To associate a symbol with sightings individual counts; enter the low and high values for the count, hen select the point image or set the point size (see above). Click the + button to add the entry to the list. N.B. If the sightings selection to be mapped contains more than 1 species then the number of species seen at the location of the point will be used to determine which point marker will be displayed.