Sightings Analysis
Wildlife Recorder Data Analysis allows you to analyse the sightings data contained in your database. The analysed data can be output as a comma separated file, which can be used to produce grpahs and further analysis ising a spreadsheet program such as Microsoft Excel.
To produce an analysis:
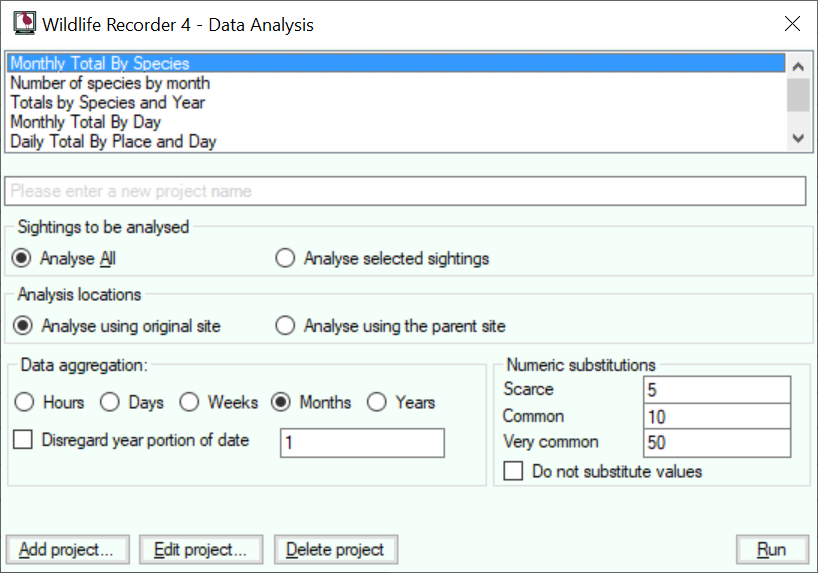
A list of supplied Analyses is shown, select the Analysis you wish to perform from the list. A number of preset analyses is provide but it is possible to create your own by entering the name that you wish to give the project in the new project name field and then clicking the Add project button. See Analysis Parameters
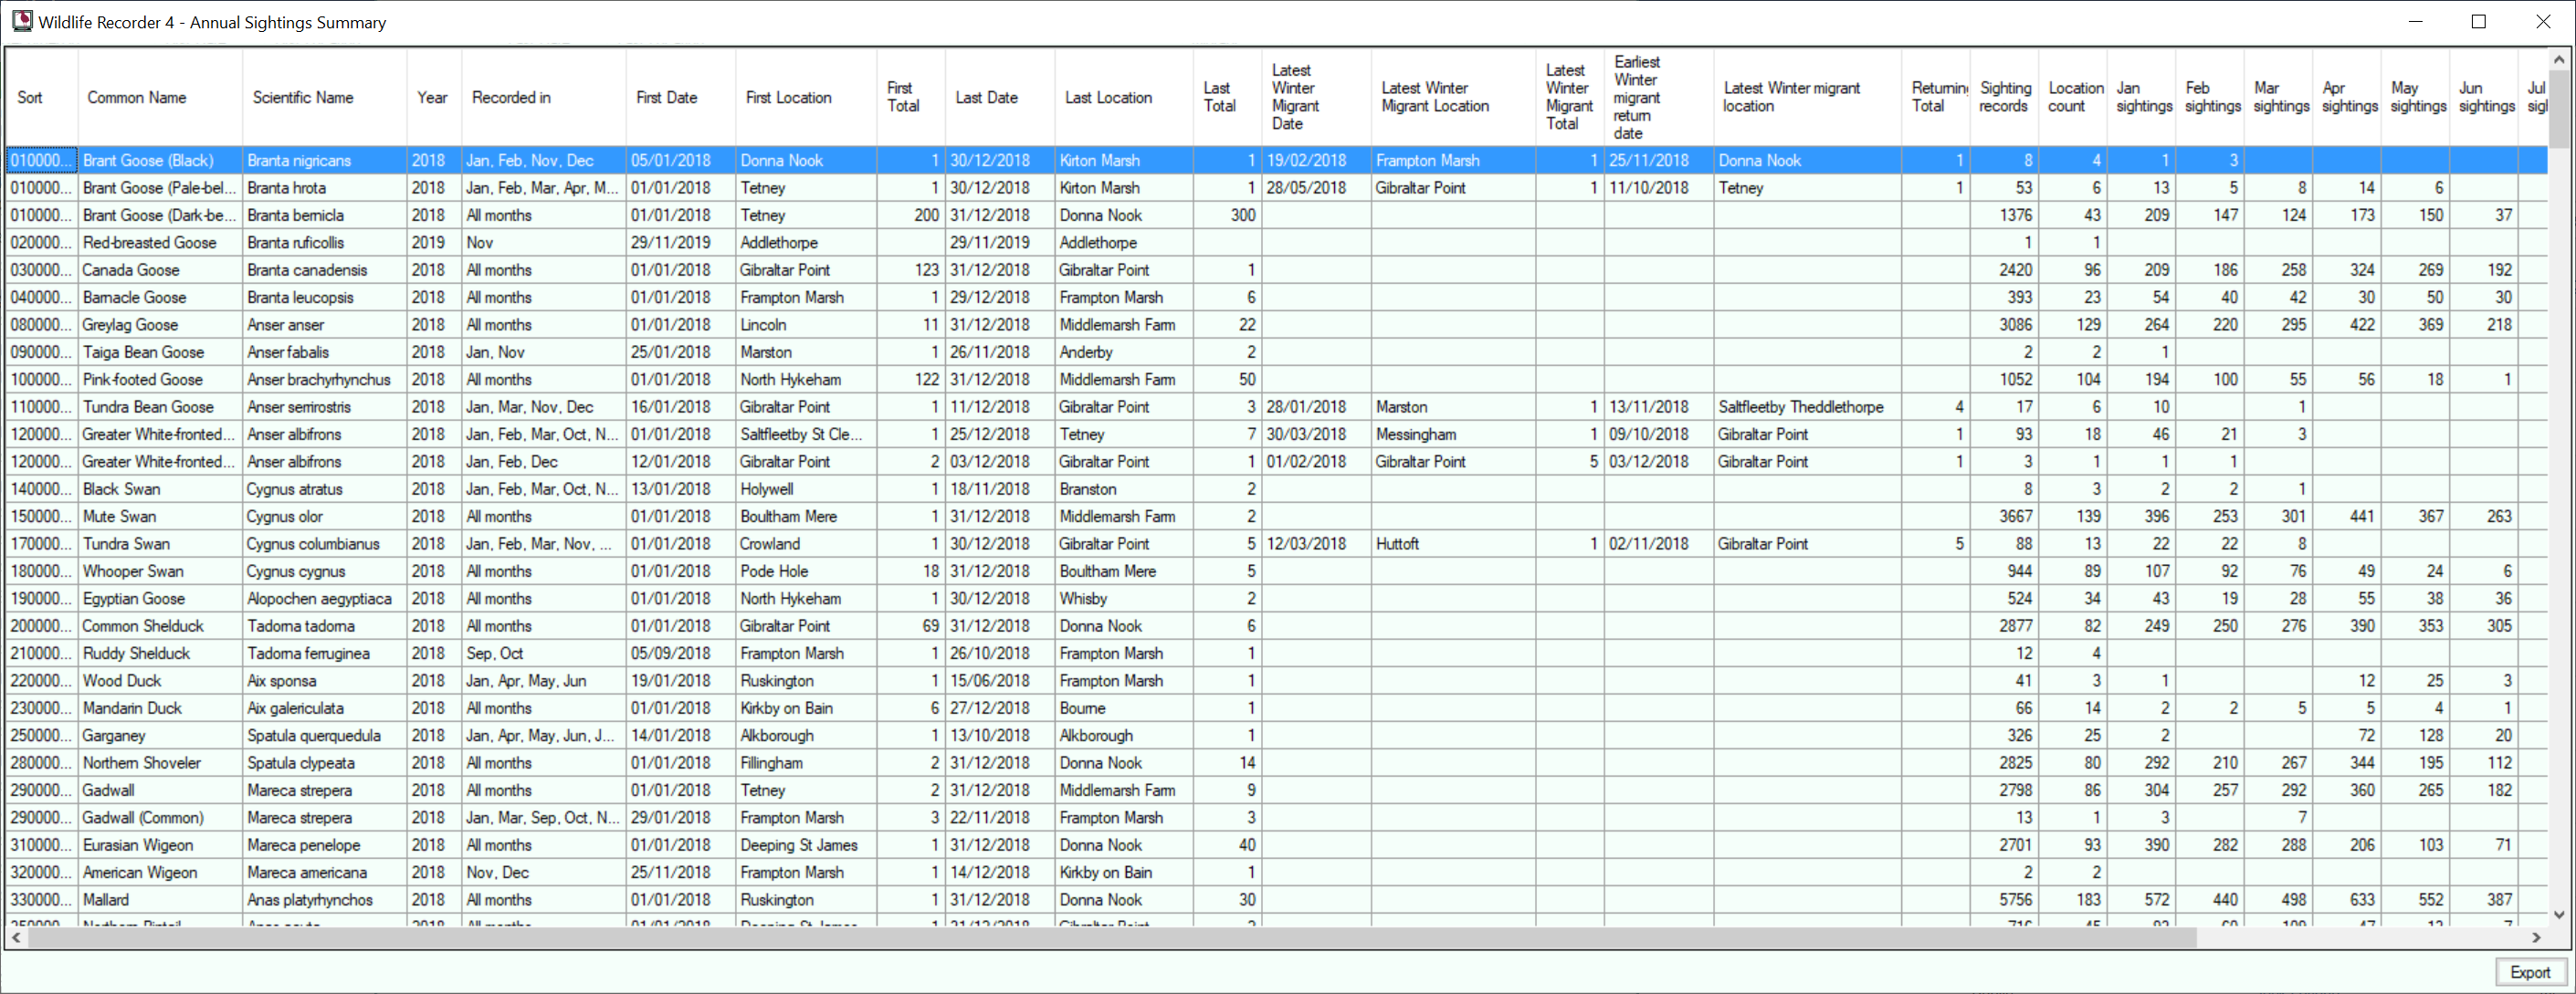
The "Annual Sightings Summary" is a special analysis with performs a detailed annual analysis of sightings including month counts, first and last dates and locations recorded and early and late winter migrant dates, see example below.
- Select Analyse All to perform an analysis on all the sightings shown in the Sightings Results form. Select Analyse selected sightings to analyse only the specific sightings you have selected from your Sightings results. Select Analyse using original site to analyse the sightings using the original site name from the sightings records.
- Select Analyse using the parent Site to perform the analysis using the name of the top level parent. If a site is not a child of another site then its own name will be used.
- If your analysis is being aggregated using a date then you can choose the interval which is to be used as follows:
Select the period to be used Hours, Days, Weeks, Months or Years.
Select the number of of periods, e.g. to perform an analysis for 2 monthly periods, select Months and enter 2.
If you are aggregating by month or day you can disregard the year portion of the date by checking the Disregard Year portion of date option. This will give an an analysis for each day or month but disregarding the year portion of the date in the sightinbgs records being analysed. - Many analysis will aggregate the number of individuals seen using the Total and New counts from the sightings records being analysed. The analysis needs to know how to calculate values for sightings which have abundance values such Common, Scarce in the sighting. You can either ignore abundance values or provide a real value instead of the abundance value.
To ignore abundance values check the Do not substitute values option.
If you do wish to substitute values the enter the values to be used for each abundance level in each of the abundance levels fields.
To Delete an Analysis
- Select the analysis you wish to delete from the Analyses list.
- Click on the Delete Project button to delete the analysis.
- When requested, confirm that you wish to complete the deletion.
Annual Sightings Summary Example